Numbers break at the edges
Ask most portfolio tools where they can go wrong and they will point you at the model. The betas. The scenario weights. The simulation. That is where the arguable work sits, and it is where the arguments happen.
It is not where the errors come from.
The column that means two things
Your broker exports a column called Cost Basis. At one broker it is the average
cost per share. At another it is the total you paid for the whole position.
Read one as the other and a $101 holding imports at $5,050.
Nothing about $5,050 looks wrong. It is a plausible price for a plausible company, sitting in a table of other plausible numbers. But the position has
been scaled by its own share count, and everything downstream inherits it: position value, portfolio weight, scenario impact, Value at Risk. The portfolio is now wrong in a way that reads as fine.
Separators do a smaller version of the same thing. In Frankfurt, 1,5 is one and a half shares. Strip the comma the way a US-shaped parser would and it becomes fifteen.
Why nothing commits until you confirm it
Any parser that reads real documents is a stack of heuristics, because every broker names its columns differently and none of them asked us first.
Heuristics are fine when a person checks the output. They are dangerous when nobody does.
So the importer does not write to your portfolio. It writes to a review table — ticker, quantity, cost, all of it editable, with a running total you can check
against your account before anything commits. Rows it is unsure about are flagged in place. Where a per-share cost was derived by dividing a total, the row says so. Where no column headers were found at all, the whole import is marked and you are told the roles were inferred.
The importer is allowed to be wrong. It is not allowed to be wrong quietly.
Why it runs in your browser
Reading a spreadsheet on your device is harder than posting it to a server. We built it that way anyway.
A brokerage statement carries your positions, your share counts and your account balance. There is no version of that arriving on a server — ours or anyone else's — that we would want to defend. So the file is parsed on your
device and stays there. Nothing is uploaded. No model reads it. That is a property of how it is built rather than a promise about how we behave.
The cost is real. Scanned statements and photographs are not supported, because there is no text in them to read. Optical character recognition would cover
those, and would occasionally read an 8 as a 3 — producing, again, a number that looks completely ordinary and is completely wrong. We declined that trade.
What travels with a number
The second edge is what leaves. Exported figures get pasted into messages,
screenshotted into threads, and cited months later by people who never saw the
assumptions behind them.
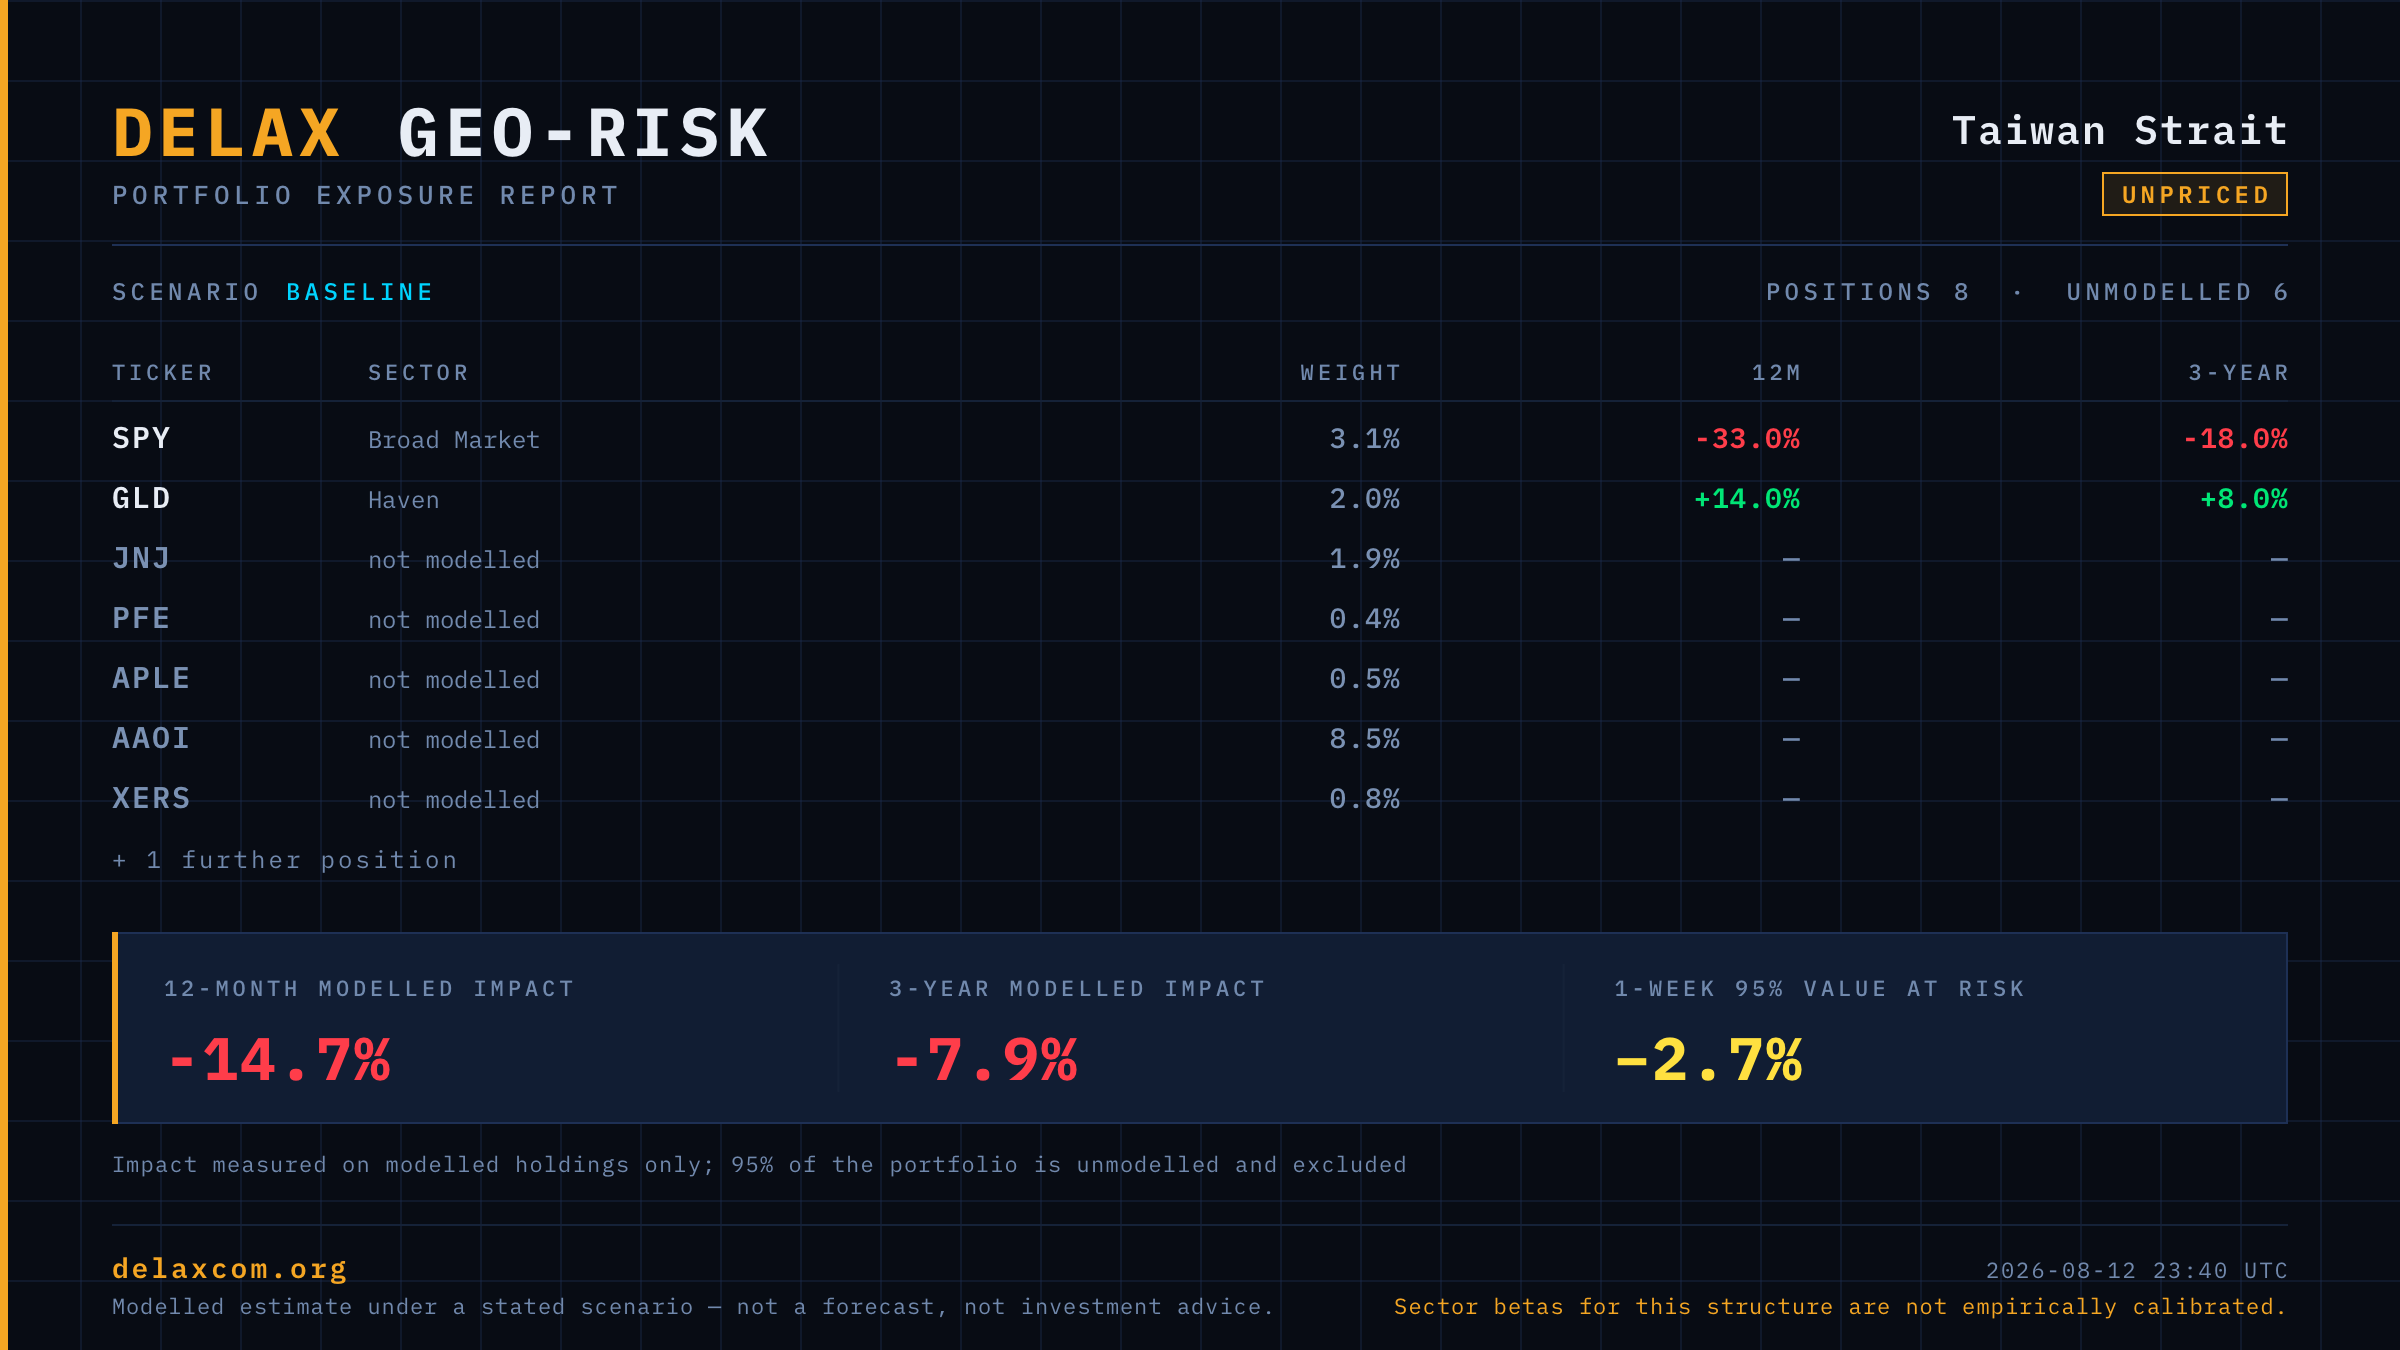
So the evidence tier travels with them. The share card renders the structure's calibration badge above the figures, and there is no setting that removes it. A
Taiwan card states on its face that the sector sensitivities behind it are not empirically calibrated. The spreadsheet carries a third sheet with the
structure, the tier, the scenario multiplier, the denominator rule and the VaR method.
The denominator matters more than it sounds. Impact is measured on modeled holdings only. Anything the active structure does not cover is excluded rather than scored as zero, and the export states how much was excluded instead of quietly improving the headline.
Why the card hides the money
The share card exists to be posted in public, so it shows weights and percentages and suppresses absolute values by default.
That includes Value at Risk, which is normally quoted as a dollar loss. On a card where everything else is hidden, that one figure would give away the
portfolio size the rest of the card is withholding. It renders as a percentage instead.
You can switch the values back on. That is a decision you make once, rather than one you discover after posting.
The spreadsheet and the CSV carry everything. Those are yours.
Holdings import from .xlsx, .csv and text-layer PDF is live in the Investor Workspace. How the figures are produced: DelaxCom.org/methodology.